#Rstats #ggplot2: Plotting Functions with stat_function, Adding Labels and Legends. Tunning your plot!
For my Master thesis i need to plot functions, and of course, i'm using ggplot2
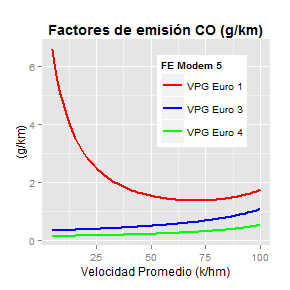
vpge0: Vehículo Pasajeros Gasolineros Pre-Euro
vpge1: Vehículo Pasajeros Gasolineros Euro 1
vpge3: Vehículo Pasajeros Gasolineros Euro 3
vpge4: Vehículo Pasajeros Gasolineros Euro 4

vpge0: Vehículo Pasajeros Gasolineros Pre-Euro
vpge1: Vehículo Pasajeros Gasolineros Euro 1
vpge3: Vehículo Pasajeros Gasolineros Euro 3
vpge4: Vehículo Pasajeros Gasolineros Euro 4


Comentarios
Publicar un comentario